- Introduction
In the pulp industry, the greatest challenge is reconciling high-quality products with greater production capacity, something common in most modern Brazilian mills. In addition, companies increasingly seek to diversify with high value-added products, such as prime and extra-prime grades. Actions to maximize resources and raw materials and minimize quality losses are therefore imperative to remain competitive (KÄLKÄJÄ, KOSKINEN and FURLEY, 2008; PIKKA et al, 2019).
In this context, one of the quality losses with the greatest impact on the final product is dirt, which causes dark specks in the pulp sheet and leads to downgrading when the value exceeds 2.00 mm²/kg in the finished product (Fig. 1). Dirt can be classified as shives, slivers, specks, pitch, sand, etc.
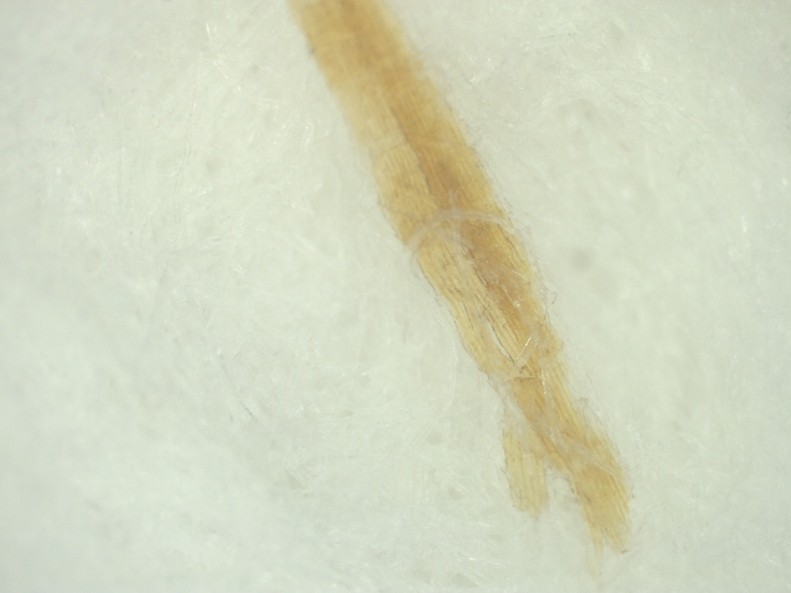
Figure 1 – Dirt in the final product caused by shives (Source: author’s photo, 2021)
In many mills, most dirt losses are caused by the presence of shives. Understanding shives and their impacts, and establishing actions to mitigate them, is therefore crucial.
The purpose of this article is to present a practical, structured guide to mapping shives along the fiber line and assessing whether operating strategies are producing the necessary and sufficient effects.
- Understanding Shives and Their Impact
During Kraft cooking, not all chips undergo uniform delignification, generating a fraction of material known as rejects and shives (MATTIAZZO et al, 2018). Shives are defined as poorly cooked or incompletely defibered wood particles that remain after cooking and/or in later stages (Fig. 2). In general, it is impossible to avoid generating shives; they can be reduced, but not eliminated.
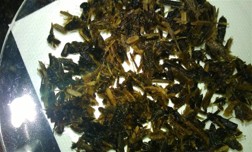
Figure 2 – Shives (Source: author’s photo, 2021)
The presence of shives in pulp affects the quality of the final product in several ways:
- Lower visual quality (black specks on the sheets);
- Higher bleaching chemical consumption (more severe bleaching);
- Higher fiber losses (rejects and rework);
- More defects in the paper (loss of physical strength).
Mills have therefore taken a series of actions to reduce or mitigate the effect of shives on the product. Strategies to reduce the generation of rejects/shives include improving chip quality (reducing thickness variability) and, consequently, improving chip impregnation by the cooking liquor, as well as increasing the alkali charge and H-factor in the digester (FOEKEL, 2007).
Another way to reduce rejects/shives would be oxygen delignification and more drastic bleaching. But at what cost, and with what limitations?
It should be noted, however, that a higher addition of chemicals (chlorine dioxide, caustic soda, peroxide, etc.) affects pulp viscosity and generates more AOX in the bleaching filtrates, especially chlorine dioxide.
- Mapping Shives in the Process
Mapping shives means identifying the critical points where they are generated and accumulate (PIKKA et al, 2019). It is therefore necessary to systematically map the entire fiber line (Digester, Oxygen Delignification, Screening and Bleaching).
Starting with Wood Preparation, variation in nominal chip dimensions has a greater impact on reject generation than other factors, such as alkali charge and its distribution and the H-factor. The less uniform the size of the chips entering the digester, the higher the shive content (assuming the same Kappa targets are maintained). Measuring shive content reflects variation in chip dimensions more accurately than the Kappa number.
The Digester is a crucial point, where poor impregnation, liquor channeling, uneven alkali charge distribution and a non-uniform temperature profile can lead to higher reject generation, since they cause non-homogeneous chemical reactions during cooking.
Another important point to monitor is Oxygen Delignification, which plays a significant role in reducing rejects. It dissolves the residual lignin present in shives, softening them and making them easier to break up and to bleach. Instability in the operating parameters of this stage (feed consistency, oxygen charge, alkali charge, temperature, reactor pressure, etc.) can therefore impair shive removal (VERACEL, 2017).
Screening is also a critical point and a crucial stage for minimizing rejects in the fiber line. Likewise, instability in the operating parameters of this stage (feed consistency, pressure differential, reject rate, etc.) can compromise shive removal.
Finally, in Bleaching, the first stages (DA or DHOT, EP or EOP) play an important role in reducing and controlling shives. Variations in operating parameters (Kappa factor, pH, temperature, feed consistency, retention time, chemical charge, etc.) also interfere with shive reduction (HART and RUDIE, 2012; HART, 2019).
- Mapping methodology
- Sampling plan
The first step is to establish the sampling points, i.e. the key points of shive generation/accumulation, as described in the previous section.
In Figure 3, as an example, a fiber line consisting of a continuous digester – brown stock washing – oxygen delignification – screening – post-screening washing – 3-stage ECF-light bleaching (DA, Ep and D1) was considered:
- P1 – Digester outlet;
- P2 – Oxygen delignification reactor feed;
- P3 – Primary screen feed;
- P4 – Primary screen accepts outlet;
- P5 – Screened pulp washer inlet;
- P6 – DA stage inlet (1st bleaching stage);
- P7 – DA stage outlet;
- P8 – EP stage outlet (2nd bleaching stage);
- P9 – D1 stage outlet (3rd bleaching stage).
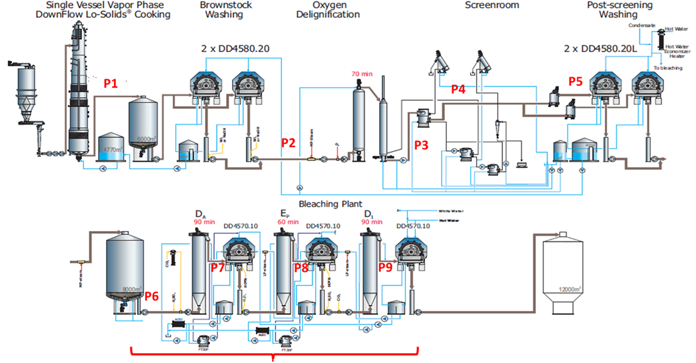
Figure 3 – Example of sampling points (Source: adapted from ANDRITZ, 2014)
The second step is to define the sampling period or frequency. Initially, a frequency of twice a day for a period of one (01) month is recommended, coinciding with day-shift hours to fit the quality control laboratory routine.
- Methodology
For the samples collected at points 1 to 5, determine consistency and reject content according to SCAN17:64 and Somerville T275 sp-12.
The Somerville screen provides good retention of impurities using 0.15 mm slots, because the rejects are class I, II and III and due to their size (see impurity classification Tappi T-213 om – 21).
For the samples collected at points 6 to 9, prepare handsheets and measure the number of shives per sheet and dirt (mm²/kg), as well as consistency. Since shive dimensions become very small (Classes 4 and 5 – Tappi T-213), retention becomes more difficult on the Sommerville screen (0.15 mm slots). It is therefore recommended to determine the amount of shives visually!
The reason for measuring the number of shives per sheet is that shives (minishives) are reduced to a very small fraction and those that remain in the pulp are very small.
4.3 Evaluation of results
Analytical tools such as a Pareto chart or a boxplot of reject content (sampling points 1 to 5), relating % rejects to sampling points, can be used to evaluate the results. This makes it possible to assess behavior/performance in terms of reject/shive reduction after the Blow Tank, Oxygen Delignification, Screening and Post-Screening Washing, and to build a profile.
To evaluate the shive profile in bleaching (sampling points 6 to 9), a boxplot of the number of shives per sheet versus sampling point is suggested. A boxplot of dirt (mm²/kg) versus sampling point can also be built.
This makes it possible to assess behavior/performance in terms of reject/shive reduction in the bleaching stages and to build a profile.
- Final considerations
Shive mapping proves to be an essential tool for understanding the dynamics of generation, removal and eventual reincorporation of these impurities in bleached eucalyptus pulp. The proposed systematic approach, based on a structured sampling plan, suitable analytical methods and statistical tools such as boxplots and Pareto charts, makes it possible not only to identify the critical points of the process, but also to quantify the efficiency of each stage in mitigating rejects.
The results obtained from this type of analysis show that shive formation is strongly associated with operating variability, mainly in chip quality and in the efficiency of impregnation and cooking in the digester. However, it is also clear that subsequent stages, such as oxygen delignification, screening and bleaching, play a decisive role in reducing (or amplifying) these initial effects.
Another relevant point is that strategies based solely on increasing chemical severity, although effective in the short term, can have significant negative impacts, such as lower pulp viscosity and a higher environmental load. Shive control should therefore be driven primarily by operational stability and variability control, and not only by intensifying process conditions.
Using shive mapping as a management tool therefore allows mills to:
- Act proactively at the source of the problem (wood and digester);
- Adjust operating parameters based on data and evidence;
- Reduce quality losses and associated costs;
- Increase the robustness and stability of the operation;
- Sustain pulp production at higher grade levels (prime and extra prime).
Finally, plants that routinely incorporate this approach tend to evolve toward more advanced levels of control, integrating process, quality and energy performance data and moving toward increasingly optimized, predictable and competitive operations in the global bleached eucalyptus pulp market.
- References
BS EN ISO 5350-2:2006 – Pulps. Estimation of dirt and shives – Inspection of mill sheeted pulp by transmitted light. British Standards Institution. Available at: <https://doi.org/10.3403/BSENISO5350>. Accessed on: May 24, 2026.
FOEKEL, C. – Resíduos sólidos industriais da produção de celulose Kraft de eucalipto. Parte 01: Resíduos orgânicos fibrosos. Junho 2007. Available at: <http://coral.ufsm.br/dcfl/seriestecnicas/capitulo_residuos>. Accessed on: May 14, 2026.
HART, P. W., RUDIE, A.W. – The Bleaching of Pulp. Tappi Press, 5. Ed., Atlanta, GA, 2012.
HART, P. W. – Pulp bleaching. Kirk Othmer Encyclopedia of Chemical Technology, p.1–30, 2019. Available at: <https://www.researchgate.net/profile/Peter-Hart-2/publication/333715181_Pulp_Bleaching/links/63e6999fe2e1515b6b876ed5/Pulp-Bleaching.pdf >. Accessed on: May 24, 2026.
ISO 5350-2:2006 – Pulps – estimation of dirt and shives – Part 2: Bleached pulps. In: ISO Standards Handbook – Paper boards and pulps. 2006.
KÄLKÄJÄ, T., JARMO KOSKINEN, J. and FURLEY, M. – Online fiber and shive measurement enhances quality in chemical HW pulping. 2008. Available at: <https://www.eucalyptus.com.br/artigos/2008-Online+Fiber+Analyser.pdf>. Accessed on: May 20, 2026.
MATTIAZZO, F. B. et al. – Utilização de valores online de shives em controles avançados no branqueamento. 51° ABTCP Congresso Internacional de Celulose e Papel CIADICYP. Outubro, 23-25, 2018.
PIKKA, O., et al. – Shives and sand profile investigation in fiberline screenroom. O Papel, v. 80, n° 6, p. 83-89, 2019.
SANTOS, R.B., MUNDALY, G. – Impact of Pulpmill Operations on Papermaking: Carryover 1 – Black liquor, defoamers, dirt, shives and strategies to minimize. Tappi Centenial Celebration, 2015. Available at: <https://www.eucalyptus.com.br/artigos/outros/2015_Impact_pulp_mill_operations.pdf>. Accessed on: May 15, 2026.
VERACEL – Os fatores de sucesso para alta qualidade de celulose: 2017. Available at: <https://www.eucalyptus.com.br/artigos/2010_Optimum+Long+Fiber+Refining.pdf.>. Accessed on: May 19, 2026.
VIANNA, V., et al – Reduction of solid waste from pulp mill fiberline. 6th ICEP. November, 24-27, 2013.
TAPPI/ANSI – T 213 om – 21 – Dirt in Pulp – Chart Method. Atlanta. Tappi Press. 2021.
TAPPI/ANSI – T 275 sp – 23 – Screening of Pulp (Somerville – type equipment). Atlanta. Tappi Press. 2023.